
Measure footprint of open LLMs
Benchmark Apertus, compare with other models, and find strategies for efficient prompting.
The challenge is to measure and improve the environmental impact of the Swiss Large Language Model (Apertus, from the Swiss AI Initiative) and compare it with other models. Participants should design methods to quantify energy consumption, carbon emissions, and resource use during inference. In addition to transparent measurement frameworks or dashboards, solutions should propose concrete prompting strategies for impact reduction. The goal is to enable Switzerland to lead in sustainable AI by combining rigorous evaluation with actionable improvements.
Header photo: CSCS - Swiss National Supercomputing Centre
Purpose
The project aims to measure and improve the environmental impact of Large Language Models. It will create transparent benchmark and metrics as well as practical strategies to quantify and reduce energy use, carbon emissions, and resource consumption for inference. The goal is to enable sustainable AI that aligns with Switzerland’s leadership in responsible technology.
Inputs
A few initiatives (e.g. AI EnergyScore, MLCO2) have proposed frameworks for tracking carbon and energy usage, but these are not yet widely adopted or standardized. Based on one of these, we may try to:
- Develop measurement methods for the Swiss LLM’s energy and carbon footprint across its lifecycle.
- Explore prompting strategies for reducing impact
- Compare the energy consumption and the prompting strategies with other LLMs
- Document best practices and propose guidelines for sustainable Swiss AI.
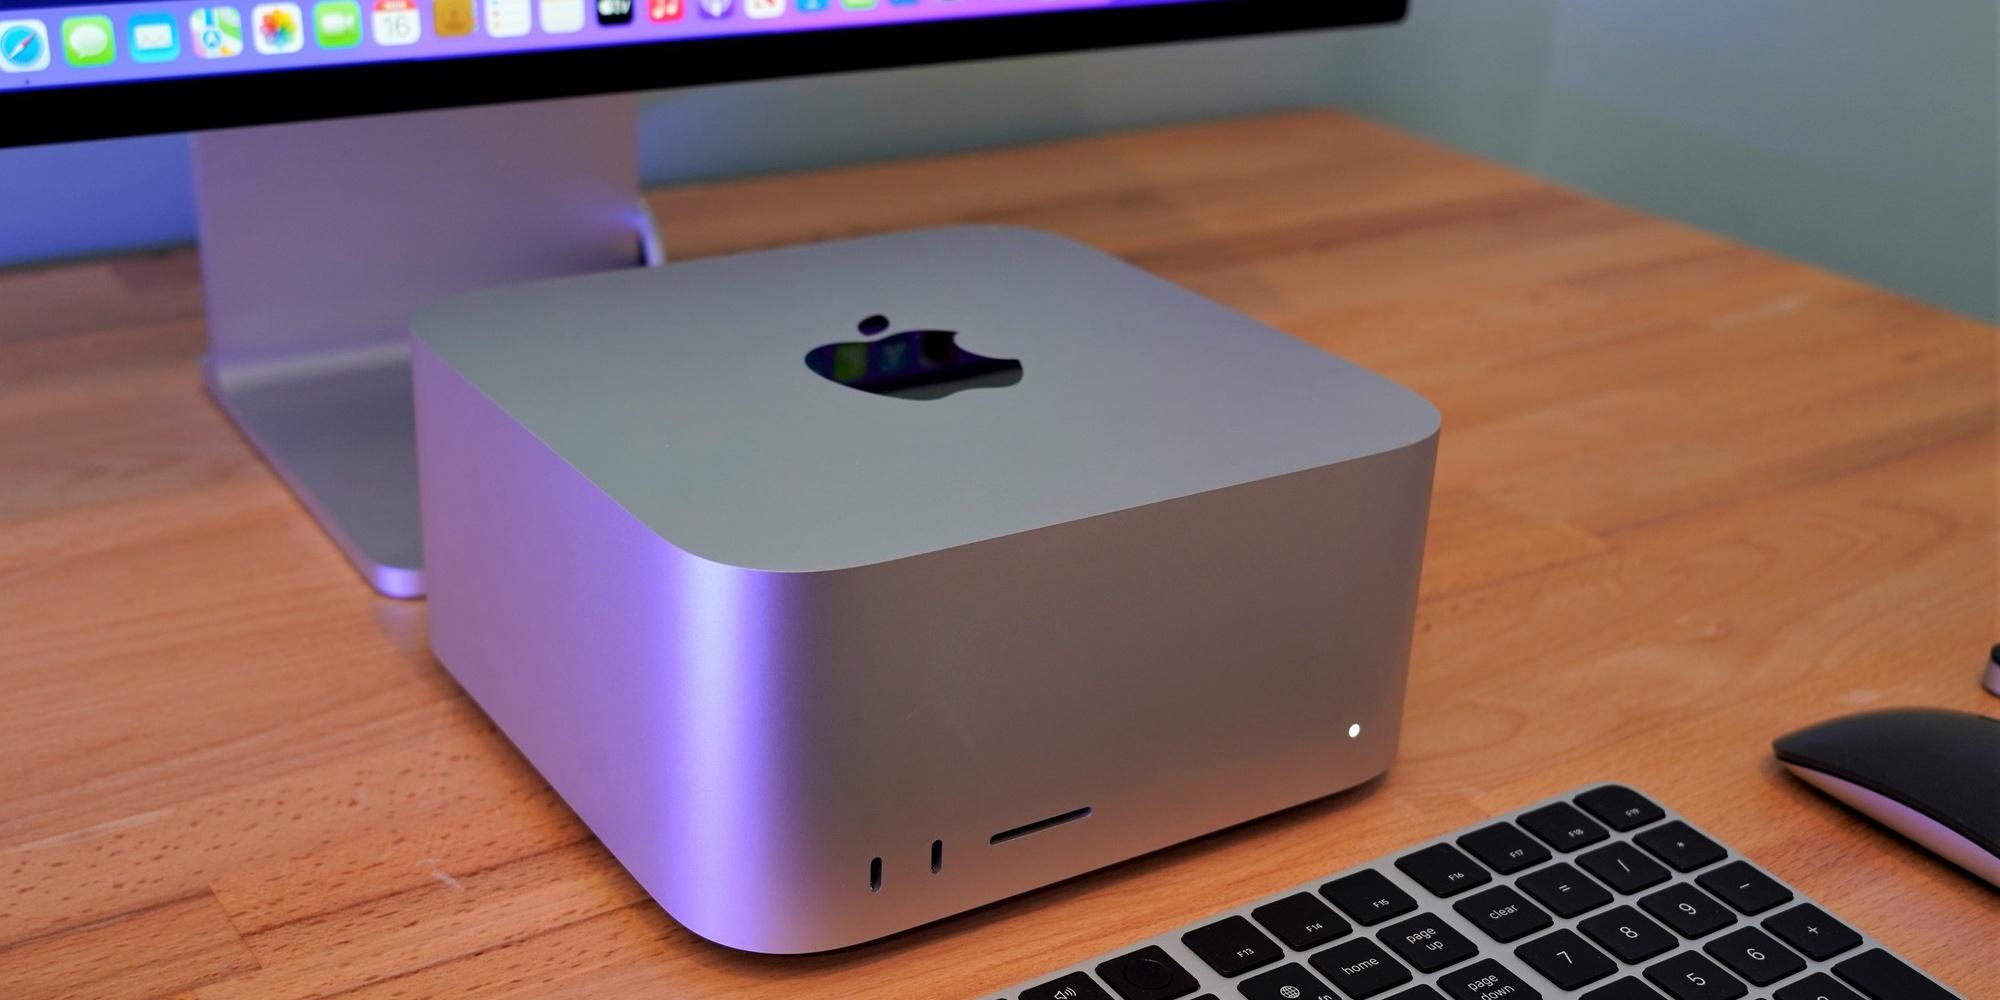
Access to open source LLMs and underlying infrastructure is required to log compute usage, energy consumption, and hardware efficiency. We will provide a test machine (12GB VRAM 32GB RAM) on location, and remote access to a Mac Studio (192GB Unified Memory) for measurements.
Some technical information on the new Swiss LLM can be found here:
https://swissai.dribdat.cc/project/40
The following resources may be of use:
- https://ss64.com/mac/powermetrics.html
- https://codecarbon.io/
- https://huggingface.co/AIEnergyScore/spaces
- https://app.electricitymaps.com/
- https://mlco2.github.io/impact/
- https://ml.energy/zeus/
Papers of note:
- Green Prompting
- Evaluating the Energy–Performance Trade-Offs of Quantized LLM Agents (Weber et al 2025)
- Large Language Model Supply Chain: A Research Agenda (Wang et al 2025)
- Characterizing the Carbon Impact of LLM Inference (Lim et al 2024)
- Towards Greener LLMs: Bringing Energy-Efficiency to the Forefront of LLM Inference (Stojkovic et al 2024)
- LLMCarbon: Modeling the end-to-end Carbon Footprint of Large Language Models (Faiz et al 2023)
- MLPerf Inference Benchmark (Reddi et al 2020)

Comparison chart by Sourabh Mehta - ADaSci 2024
As outputs, the project will deliver measurements, guidelines for measuring and prompting techniques for reducing AI impact. It directly promotes open science, climate consciousness, and responsible AI. The outcomes can catalyze a larger initiative on sustainable foundation models in Switzerland, influencing both public policy and industry adoption.
Most foundation models today are evaluated primarily on accuracy, scale, and downstream performance. Environmental impact is often reported inconsistently or not at all. Large-scale LLMs typically lack region-specific sustainability benchmarks or actionable improvement strategies, so efforts to crowdsource such results will be valuable to the community.
The activities align with the Swiss AI Initiative’s goals of advancing responsible and trustworthy AI. By focusing on Switzerland’s energy mix and regulatory context, the project addresses local sustainability priorities while producing globally relevant methods. It strengthens Switzerland’s role as a leader in sustainable and ethical AI across Europe and beyond.
Compliance
Environmental impact measurement and mitigation align with Swiss and European climate targets, responsible AI guidelines, and open science principles. Data used will be technical (compute and energy metrics), avoiding personal or sensitive information.

Illustration by Nhor CC BY 3.0
Results
The goal of the project was to
- measure the energy consumption of inference on Apertus
- understand the influence of prompt and response on the energy consumption
- Bonus: compare to llama
Our measuring infrastructure consisted of Mac Studio with remote access.
We used the powermetrics tool with Begasoft BrandBot
Experiments
- Experiment 1: Prompt/Response length
- We tested different prompt and response lengths.
- Ex: Short-Long: Explain photosynthesis in detail.
- Experiment 2: Different subjects
- Experiment 3: Compare with Llama
- Experiment 4: Different languages
Learnings
We failed successfully on:
- getting a stable setup ❌
- excluding overhead ❌
- proper energy calculations ❌
- getting 2nd system to run ❌
- do physical measurements ❌
- change measurement method ❌
- automate everything ❌
- doing proper statistics ❌
We succeeded successfully on:
- measure idle consumption ✅
- measure different prompts ✅
- Integrated a new team member ✅
- learn a lot ✅
- having fun! ✅
Results
Measuring is hard!
Prompt size:
- long answers dominate the energy use
- long prompts have some influence
Different types of prompts: Basic knowledge, Chemistry, Geography, Math does not seem to influence the energy consumption (other than the length of the response)
Different languages: apart from the length, the language seems to have some influence (portugese: +20%)
Different models: inconclusive but similar
Reports
Thanks to all!
Energy Footprint Analysis of Open LLMs
This repository contains the results and methodology from the swissAI Hackathon challenge "Measure footprint of open LLMs".
🔗 Challenge Details: https://swissai.dribdat.cc/project/44
Team Members
- Agustín Herrerapicazo - agustin.it@proton.me
- Luis Barros - luisantoniio1998@gmail.com
- Stefan Aeschbacher - stefan@aeschbacher.ch
Project Overview
This project investigates the energy consumption patterns of the Apertus language model through controlled experiments measuring various aspects of prompting behavior.
Goals
- Primary: Understand the energy consumption characteristics of Apertus
- Secondary: Analyze energy impact across different prompting dimensions:
- Prompt length
- Response length
- Language of the prompt
- Subject matter of the prompt
- Optional: Compare Apertus performance with Llama 7B
Limitations
⚠️ Important: Apertus is in early development stages. Quality assessments would be premature and unfair at this time.
Infrastructure
Systems Used
-
Mac Studio (Primary)
- Remote access capability
- Physical measurement limitations due to remote setup
- Used for all experimental measurements
-
Shuttle with 8GB Nvidia GPU (Available but unused)
- Not utilized in final experiments
Measurement Validation
Initial testing revealed a 3x-4x discrepancy between powermetrics readings and physical measurements on the Mac Studio. Due to time constraints, this variance was noted but not fully investigated.
Measurement Tools & Scripts
Energy Measurement Script (measure.sh)
Custom bash script that orchestrates energy measurement using powermetrics:
Features:
- Real-time power monitoring with 100ms sampling intervals
- CSV output with structured data format
- Live progress display during measurement
- Automatic calculation of cumulative energy consumption
- Statistical analysis (min/max/average power, standard deviation)
Usage:
./measure.sh <duration_in_seconds> [test_name]
./measure.sh 60 "SS_math_test"
Output Format:
sample,elapsed_time,power_mw,cumulative_energy_j,test_name
1,0.10,380.00,0.038000,test_short_short
2,0.20,318.00,0.069800,test_short_short
Efficiency Analysis (quick_efficiency.py)
Python script for calculating token-to-energy efficiency metrics:
Key Metrics:
- Tokens per Joule (efficiency rating)
- Joules per Token (energy cost)
- Tokens per Second (processing speed)
- Energy efficiency rating system (⭐⭐⭐ Excellent > 1000 tokens/J)
Usage:
python3 quick_efficiency.py data.csv "model output text"
Data Visualization (test.py)
Comprehensive analysis and visualization tool:
Capabilities:
- Multi-file comparison analysis
- Power consumption profiles over time
- Statistical analysis with error bars
- Efficiency comparison charts
- Automated plot generation
Features:
- Single test detailed analysis
- Multi-test comparative analysis
- Normalized time comparisons
- Energy consumption trends
Powermetrics Integration
- Platform: Mac Studio
- Command:
powermetrics --samplers cpu_power -i 100 -n <duration> - Sampling Rate: 50ms effective (100ms configured with processing overhead)
- Metrics: Combined CPU/GPU power consumption in milliwatts
Yocto-Watt
- Type: Physical energy consumption device
- Usage: Baseline understanding of machine behavior
- Link: https://www.yoctopuce.com/EN/products/usb-electrical-sensors/yocto-watt
Experimental Setup
Standard Configuration
- Sampling Rate: 50ms intervals
- Powermetrics Command:
powermetrics --samplers cpu_power -i 100 -n "$DURATION"
Baseline Measurements
- Idle Consumption: 10 runs × 30 seconds each
- Observation: Irregular consumption peaks during idle state
- Impact: Background processes affected measurements but were accepted due to time constraints
Experiments & Results
1. Prompt Length Impact
Test Files: test_short_short, test_short_long, test_long_short, test_long_long
Tested all permutations of prompt and response length combinations to isolate energy consumption factors.
Methodology:
- Short prompts: ~10-20 words
- Long prompts: ~100+ words
- Short responses: ~10-50 tokens
- Long responses: ~200+ tokens
- Duration: ~260 seconds per test
Key Finding: Response length showed stronger correlation with energy consumption than prompt length.
2. Subject Matter Analysis
Test Files: test_short_topic_1 through test_short_topic_10
Evaluated energy consumption across different domains with consistent short prompt/short response format:
- Basic Knowledge
- Geography
- Chemistry
- Mathematics
- History
- Science
- Literature
- Technology
Methodology:
- 10 different subject prompts
- Consistent response length target
- ~270 seconds per test
- Statistical analysis across topics
Result: Subject matter showed minimal impact on energy consumption. Response length remained the primary factor. Average energy consumption varied by less than 5% across different topics.
3. Language Comparison
Test Files: test_short_language_1 through test_short_language_4
Tested four languages with controlled response lengths:
- German (
test_short_language_1) - Spanish (
test_short_language_2) - Portuguese (
test_short_language_3) - English (
test_short_language_4)
Methodology:
- Identical semantic prompts translated to each language
- Target response length controlled
- ~290 seconds per test
- Power consumption analysis
Notable Finding: Portuguese consumed approximately 20% more energy for similar response lengths, warranting further investigation. This could indicate tokenization differences or model efficiency variations across languages.
4. Apertus vs Llama 7B Comparison
Test Files: test_short_llm_fight_1 through test_short_llm_fight_4
Limited comparison between models with controlled prompt/response scenarios.
Methodology:
- Identical prompts for both models
- Short prompt, short response format
- 4 comparative test runs
- ~300 seconds per test
Result: No clear energy consumption trend identified. Both models showed similar energy usage patterns, with Apertus consuming approximately 50J more in comparable scenarios. More extensive testing needed for statistical significance.
5. Baseline Measurements
Test Files: idletest_*, test10 through test20
Idle Consumption Study:
- 10 runs of 30-second idle measurements
- Mac Studio background processes created measurement variance
- Standard deviation: ~15-20% of mean idle power
- Average idle power: ~250-300mW
Measurement Stability:
- 20 repeated measurements under identical conditions
- Assessed measurement reproducibility
- Identified systematic measurement overhead from powermetrics
Key Findings
- Response Length Correlation: Strong positive correlation between response length and energy consumption
- Prompt Length Impact: Minimal influence on overall energy usage
- Language Variance: Portuguese showed unexpected 20% higher consumption
- Model Comparison: Apertus and Llama 7B perform similarly in energy usage
Limitations & Future Work
Identified Issues
- System Stability: Mac Studio showed high idle consumption variance
- Measurement Overhead: Powermetrics introduces CPU load and timing discrepancies (~20ms vs 100ms target)
- Physical vs Digital: 3x-4x gap between powermetrics and physical measurements needs quantification
- Sample Size: Limited runs per experiment due to time constraints
Recommendations
- Investigate and eliminate idle consumption variance sources
- Quantify powermetrics measurement overhead impact
- Establish correlation between digital metrics and physical power consumption
- Increase sample sizes for statistical significance
Technical Implementation
Data Collection Pipeline
- Measurement Script (
measure.sh): Orchestrates powermetrics data collection - Real-time Processing: AWK script processes powermetrics output stream
- Data Storage: Structured CSV format with timestamp synchronization
- Analysis Tools: Python scripts for statistical analysis and visualization
File Structure
├── measure.sh              # Main measurement orchestration script
├── quick_efficiency.py     # Token efficiency analysis tool
├── test.py                 # Data visualization and comparison
├── data/                   # Experimental results (42 CSV files)
│   ├── idletest_*          # Baseline idle measurements
│   ├── test_short_short    # Short prompt/short response
│   ├── test_long_long      # Long prompt/long response
│   ├── test_short_topic_*  # Subject matter experiments
│   ├── test_short_language_* # Language comparison tests
│   └── test_short_llm_fight_* # Model comparison tests
└── energy_analysis.png     # Generated visualization
Data Format Specification
Each measurement produces timestamped CSV files with the following schema:
sample,elapsed_time,power_mw,cumulative_energy_j,test_name
- sample: Sequential measurement number
- elapsed_time: Time elapsed since measurement start (seconds)
- power_mw: Instantaneous power consumption (milliwatts)
- cumulative_energy_j: Running total energy consumption (joules)
- test_name: Experiment identifier for batch processing
Statistical Analysis Methods
- Central Tendency: Mean, median power consumption calculation
- Variability: Standard deviation analysis for measurement stability
- Energy Integration: Cumulative energy calculation using trapezoidal rule
- Comparative Analysis: Multi-test statistical comparison with confidence intervals
Reproducibility
Dependencies
- macOS: powermetrics utility (built-in)
- Python 3.x: pandas, matplotlib for analysis scripts
- Hardware: Mac Studio (M1/M2) or compatible Apple Silicon system
Running the Experiments
# 1. Make measurement script executable
chmod +x measure.sh

# 2. Run energy measurement (requires sudo for powermetrics)
./measure.sh 300 "my_experiment"

# 3. Analyze results
python3 quick_efficiency.py my_experiment_*.csv "model output text"

# 4. Generate visualizations
python3 test.py data/*.csv
Dataset Summary
Total Measurements: 42 experimental runs Data Points: ~12,000 individual power measurements Test Categories:
- Baseline idle: 12 runs
- Prompt length: 4 systematic tests
- Subject matter: 10 domain-specific tests
- Language comparison: 4 language tests
- Model comparison: 4 head-to-head tests
- Stability assessment: 20 repeated measurements
Conclusion
This proof-of-concept demonstrates feasible methodologies for LLM energy consumption measurement and provides initial insights into consumption patterns. The comprehensive dataset of 42 experimental runs with over 12,000 data points establishes a foundation for more rigorous future analysis.
Primary Insights:
- Response Length Dominance: Strong positive correlation between token output and energy consumption
- Prompt Length Independence: Minimal energy impact from input prompt length variations
- Language Efficiency Variance: Notable 20% difference between languages (Portuguese anomaly)
- Model Parity: Apertus and Llama 7B show similar energy profiles within measurement uncertainty
- Measurement Methodology: Established reproducible framework for LLM energy analysis
Technical Contributions:
- Automated measurement pipeline with real-time analysis
- Structured dataset with comprehensive experimental coverage
- Statistical analysis framework for energy efficiency assessment
- Open-source toolset for reproducible LLM energy research
Future Work: Quantify powermetrics calibration, expand language coverage, increase statistical sample sizes, and investigate tokenization impacts on energy consumption patterns.
This work represents exploratory research conducted during a hackathon timeframe and should be considered preliminary findings rather than conclusive scientific results. All code and data are available for reproduction and extension.


Previous
Hackathon Bern
Next project